What do high-performing BDD teams do?

We recently ran a survey as part of the work to bring Cucumber into the SmartBear and HipTest family. It was a quick sample (189 responses collected in under a week) rather than in-depth research, but it yielded a couple of interesting indicators that I want to share.
We'll focus on these three questions from the survey:
- How often do you release code into production?
- Which BDD practices does your team use?
- How much experience do you have with BDD practices?
The first question gives us a measure of how successful these teams are. The second was to look for patterns in how people apply the various BDD practices, and the third question gives us a sense of how long it takes to get there.
Who are the high performers?
In their book, Accelerate, Dr. Nicole Fosgren, Jez Humble and Gene Kim choose four key metrics of a team's software delivery performance: lead time, deployment frequency, mean time to restore and change failure percentage. We picked deployment frequency as our crude proxy for this simple survey.
Let's start with a hypothesis:
Hypothesis: If you do all the BDD practices, you'll get better results.
In the overall set of data, the proportion of people releasing several times a week or more was 24%, compared to 76% releasing several times a month or less. When we look at the people who are doing all the BDD practices, we see a significant shift:
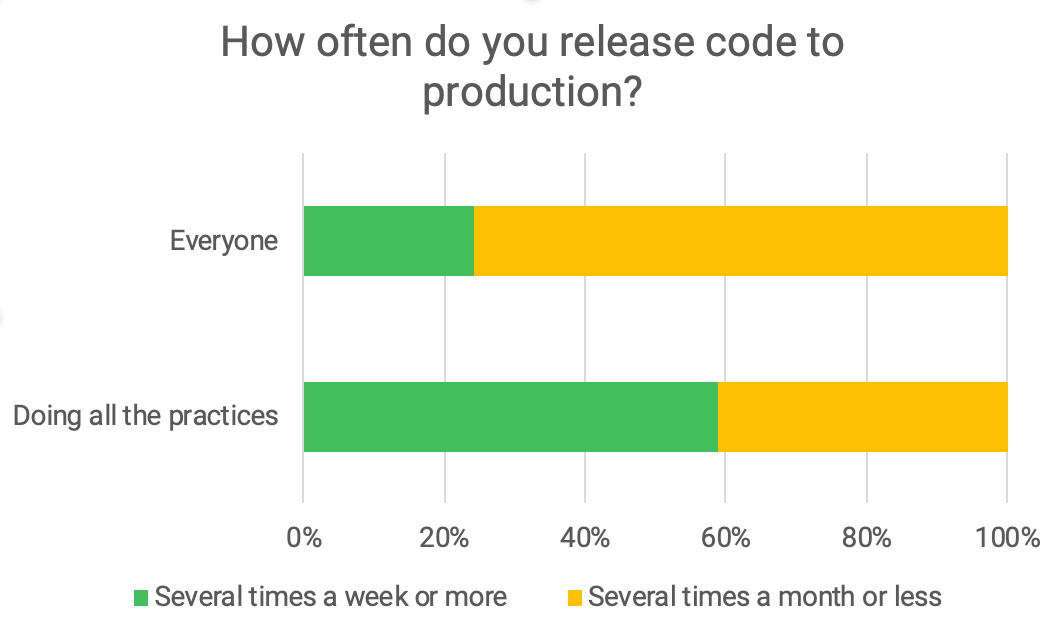
People who're doing all the BDD practices are more than twice as likely (59% vs 24%) to be releasing code to production at least several times a week than the general population in our survey.
Now all this gives us is corrolation, not neccesarily causation. While we do believe that BDD practices are enablers of frequent delivery, there's no doubt that other practices are also neccesary in order to achieve this.
Does high performance come with experience?
Let's try another hypothesis.
Hypothesis: Low performers do not have as much experience with BDD as high performers.
Here's how the data for experience levels breaks down, with our "high performers" classified as those who release at least multiple times a week:

We can see that high performance only starts to become possible after at least a year of BDD experience: there are no high performers at all in the 0-1 years bracket. Most of our high performers had at least three years of experience with BDD.
What practices make the difference?
Finally, let's examine the practices in detail to see which ones people are using.
Here are the options we offered in the survey:
- Three amigos / discovery sessions
- Expressing requirements as Gherkin scenarios
- Refining Gherkin scenarios with business stakeholder feedback
- Automating acceptance tests using Cucumber
- Using automated acceptance tests to guide development
An important practice in BDD is not only expressing requirements in Gherkin (which anyone using Cucumber for test automation would need to do), but also refining those scenarios based on stakeholder feedback. Let's see who's doing this, and what results they get:
Hypothesis: Refining scenarios with stakeholder feedback is an advanced practice used more by high performers.
My own personal experience is that using acceptance tests to guide development (i.e. TDD) is where this whole thing really starts to make sense. Does the data bear this out?
Hypothesis: High performers are much more likely to be using examples to guide development than low performers.
Here's a chart showing the proportions of high and low performers using these practices:
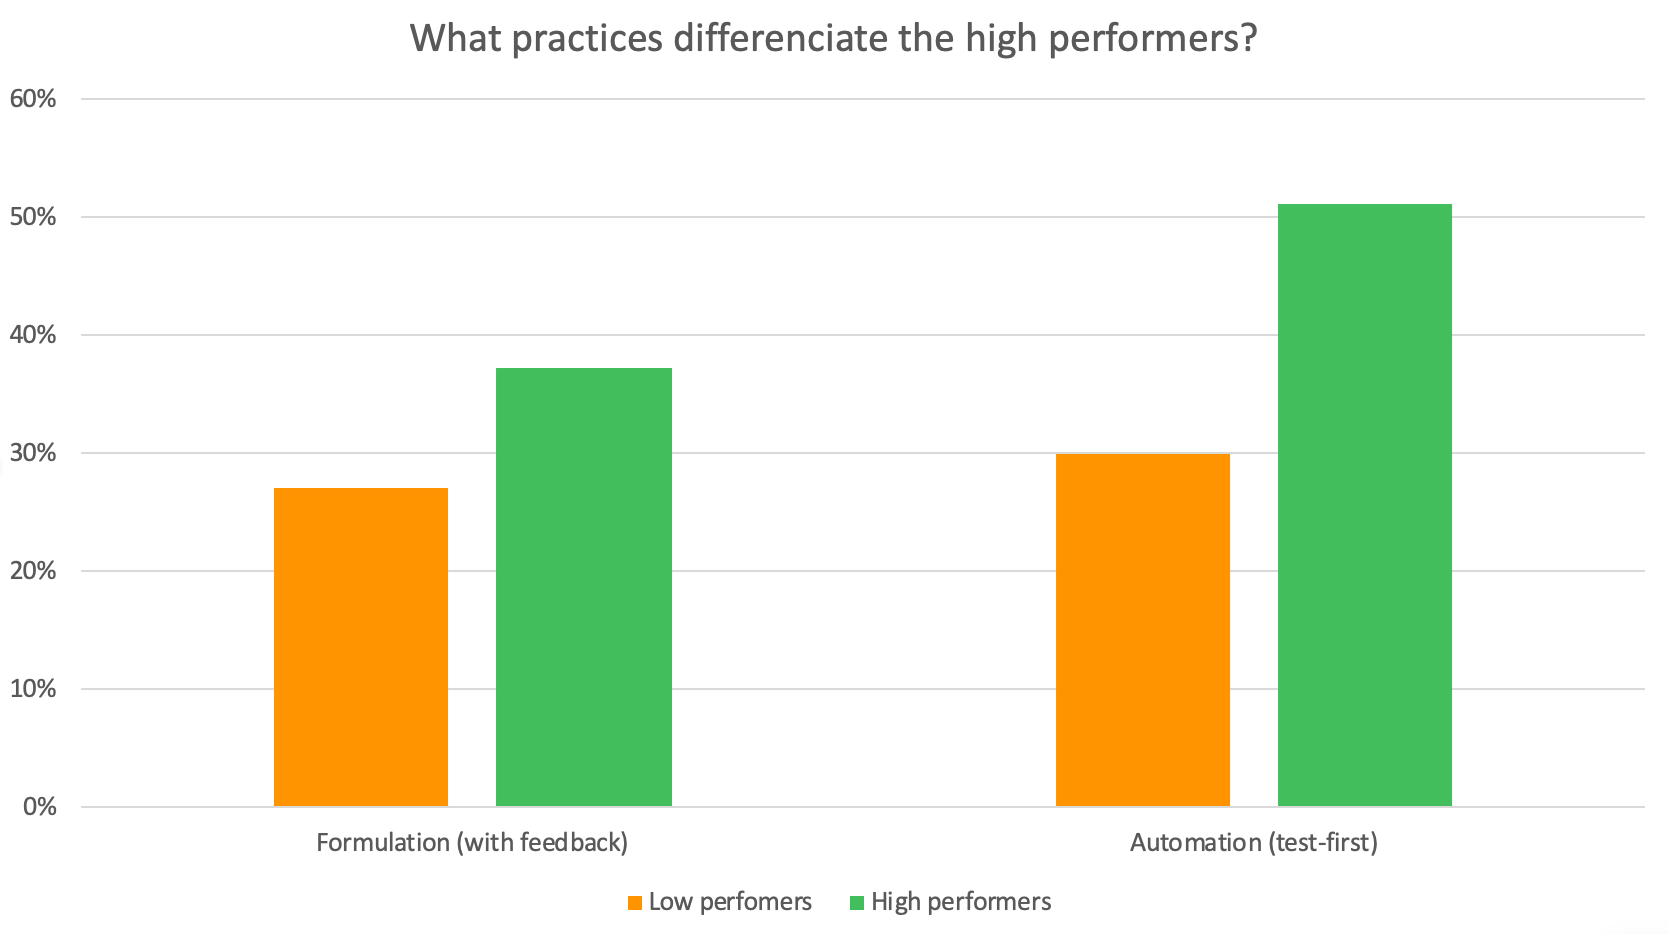
So while it's clear that it's possible to get high performance without doing either of these things, they both seem to help. Over 50% of high performers are using their acceptance tests to guide development, whle only 30% of low performing teams are doing this. 37% of high performers refine their scenarios with feedback compared to 27% of low performers.
In conclusion
This was only a quick sample survey run over a few days, with 189 responses in total. I find it very easy to get lost in these stats, but I think we've dug out some interesting ideas here that could be explored and refined by a deeper study.